YOY Calculation: How to Calculate Year-Over-Year Growth

The devil is in the comparison
Consider this: You're leading a SaaS enterprise that provides project management tools. In January this year, there's an unexpected uptick in user registrations. Naturally, you consider attributing this success to the recent interface redesign introduced earlier that month.
However, before finalizing this conclusion, a team member suggests a YoY comparison. Intriguingly, when you analyze January of the previous year, there's a similar surge in user registrations—well before any design changes were made. This pattern hints at a possible seasonal trend, perhaps with businesses seeking project management tools in January to kick off the new year effectively.
How can one differentiate genuine growth from mere seasonal patterns or fleeting spikes? The answer lies in the strategic use of YoY growth. Beyond merely assessing present achievements or setbacks, YoY growth brings to light consistent trends, allowing companies to differentiate authentic growth triggers from regular fluctuations.
In this article, you will explore in detail how to calculate YoY growth, emphasizing the nuances of YoY calculation using SQL, its significance across diverse business contexts, and its potential limitations. Additionally, you will learn how it can be effectively integrated with other metrics. This article is crafted for you if you are a data leader, data engineer, data analyst, or data scientist who are involved in building, testing, and maintaining data pipelines. The insights provided will empower you to enhance your data strategies, ensuring more accurate and efficient outcomes.
What is YoY growth
Year-over-Year (YoY) growth is a tool that businesses and analysts use to measure and compare performance changes from one year to the next. For example, one might look at the number of new users acquired in August 2023 and compare it to the new user count from August 2022. By using this method, organizations can accurately identify genuine growth trends, even when there are temporary factors that could distort the overall picture.
In practical terms, you can apply YoY growth to various important metrics within a business, such as sales, user engagement, or revenue growth. It offers a clear view of a company's performance trends over time and is vital for making informed investment decisions. Since some metrics, such as sales or revenue, can be affected by seasonal changes, YoY growth helps identify and manage these fluctuations. In essence, year-over-year growth calculation is done by comparing data from the same months across different years.
Interpretation of YoY growth in practice
When analyzing YoY growth, a consistent increase indicates that a company is doing better compared to the previous year—meaning higher sales, better profitability, or more customers. A decrease in YoY growth, on the other hand, indicates a drop in performance. It's important to note that new companies or startups might show high YoY growth percentages simply because they're starting from a low base. For established businesses, even a small positive YoY growth can signal steady and sustainable improvement.
But numbers don't operate in a vacuum. External factors, such as the overall economy and market competition can influence YoY growth. For instance, while high YoY numbers in a growing market are expected, strong growth during economic downturns indicates effective business strategies. Furthermore, comparing a company's YoY growth to its competitors or industry averages can provide additional insights, pointing out areas of opportunity or potential risks. This approach emphasizes the need for growth that is not just positive but also competitive.
Different industries have varied benchmarks for what constitutes a "good" YoY growth rate, largely influenced by market dynamics, competition, and external factors. For instance, in the rapidly evolving tech sector, especially for startups, a YoY growth rate of 100% or even higher might not be uncommon in the early stages. Conversely, for mature industries like traditional manufacturing or utilities, a YoY growth rate of 5-10% might be considered commendable. Retail businesses, depending on market saturation and competition, might aim for a YoY growth of 10-20% to stay competitive. E-commerce platforms, given their scalability and global reach, often target YoY growth rates above 20%. It's essential for businesses to not only aim for positive YoY growth but to also contextualize their growth against industry benchmarks and direct competitors to gauge their true market performance.
How to calculate year over year growth
Year over year growth formula
The principle behind the YoY change formula is straightforward. It's determined by taking the difference between a value from the current year and the same value from the previous year. This difference is then divided by the value from the previous year, and finally multiplying the result by 100 to get a percentage.
 Let’s consider a company’s revenue:
- Revenue in 2022: $1,200,000
- Revenue in 2021: $1,000,000

This means there’s a 20% YoY growth in revenue from 2021 to 2022.
Calculating year over year growth with SQL
Consider you have the monthly recurring revenue and customers' data stored in a table. To calculate the YoY growth using SQL, you can use the LAG() window functions (make sure to handle division by zero cases if there are):
select
    month,
    mrr,
    lag(mrr, 12) over (order by month) as mrr_12_months_ago,
    100 * (mrr / nullif(mrr_12_months_ago, 0) - 1) as yoy_mrr_growth,
    customers,
    lag(customers, 12) over (order by month) as customers_12_months_ago,
    100 * (customers / nullif(customers_12_months_ago, 0) - 1) as yoy_customer_growth
from
    monthly_revenue
;
In situations where you're unable to utilize the window function, you can compute the YoY growth by applying self join:
select
    mr1.month,
    mr1.mrr,
    mr2.mrr as mrr_12_months_ago,
    100 * (mr1.mrr / nullif(mr2.mrr, 0) - 1) as yoy_mrr_growth,
    mr1.customers,
    mr2.customers as customers_12_months_ago,
    100 * (mr1.customers / nullif(mr2.customers, 0) - 1) as yoy_customer_growth
from
    monthly_revenue as mr1
    left join monthly_revenue as mr2 on mr2.month = mr1.month - interval '12 months'
;
In other scenarios, when we are focusing on quarterly qualified users, the approach changes a bit. If you don't already have a table with the computed metric, start by aggregating daily signups to get quarterly qualified new users. Then, use the lag function similarly to the previous example. However, adjust the lag offset to 4 to account for the quarterly metric, looking back 4 quarters for a year-over-year comparison, as opposed to the 12-month lag for monthly metrics.
with quarterly_data as (
    select
        date_trunc(quarter, created_date) as created_quarter,
        count(distinct user_id) as new_users
    from
        users
    where
        is_qualified = True
    group by
        1
)
select
created_quarter,
new_users,
lag(new_users, 4) over (order by created_quarter) as new_users_last_year_same_quarter,
100 * (new_users / nullif(new_users_last_year_same_quarter, 0) - 1) as yoy_new_users_growth
from
quarterly_data
;If you want to drill down further and understand the growth rate by specific categories, you’ll need to modify the initial SQL query above. You will introduce the partition by clause within the window function to segment the data by the chosen category and include the category in your _select_ clause to have it displayed in the final output. For instance, let’s calculate the revenue growth rate by subscription plans.
select
    subscription_plan,
    month,
    mrr,
    lag(mrr, 12) over (partition by subscription_plan order by month) as mrr_12_months_ago,
    100 * (mrr / nullif(mrr_12_months_ago, 0) - 1) as yoy_mrr_growth
from
    monthly_revenue
;
By looking at the growth rate for each category, we can easily understand which categories are driving growth and which ones are underperforming, and provide appropriate insights to stakeholders.
Visualizing YoY growth
Now that we’ve delved into the mechanics of YoY calculation and its SQL implementation, it's equally essential to visualize this data effectively. Let's transition to tracking YoY growth visually.
To understand the evolving trend, it's insightful to first compare data across different years. A line chart serves this purpose. To create a line chart, ensure you possess a table featuring a column for the month and individual columns for each year being compared. Position the month on the horizontal axis and add data for every year as a distinct series. For enhanced clarity in observing trends, adjust the vertical axis so it doesn’t start at 0.
Consider the following graph, which presents the monthly new user metric spanning three successive years:
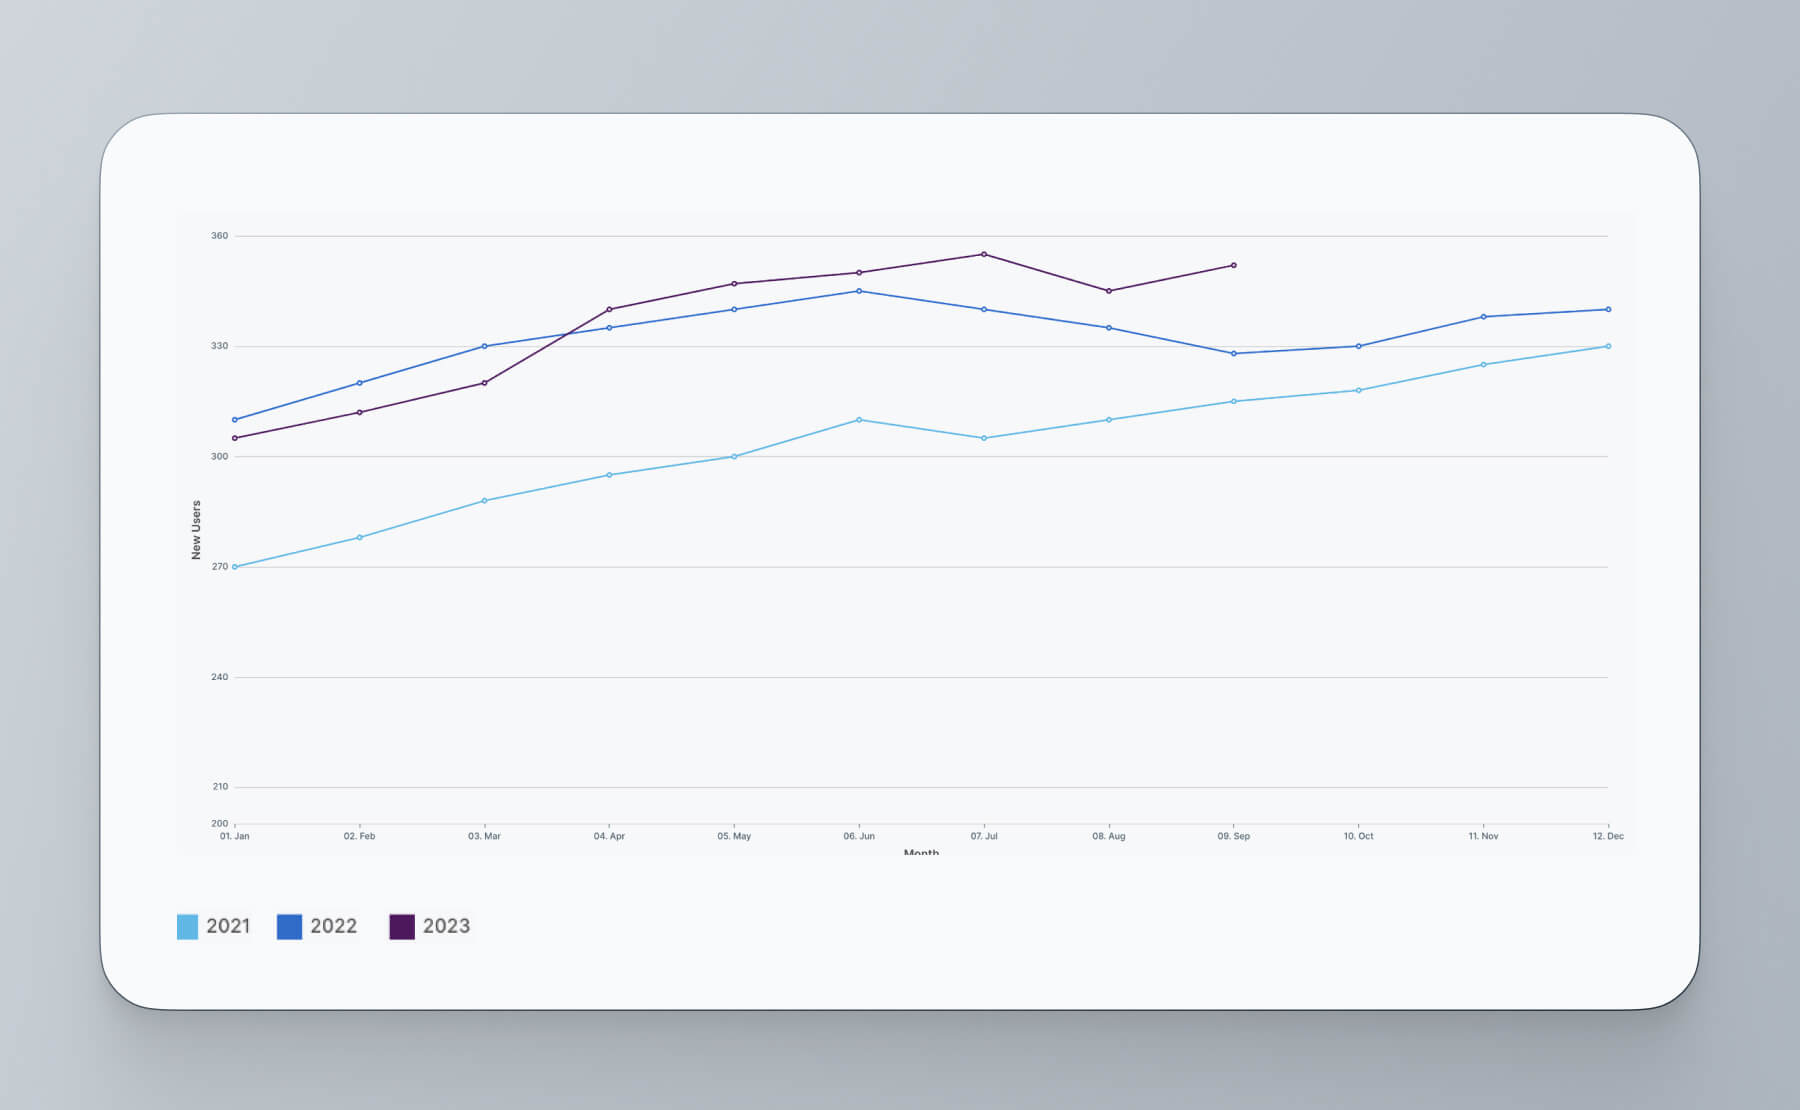
From this visualization, it's evident that challenges began emerging from the second half of the previous year, with the YoY growth for the initial months of the present year turning negative. For a more granular insight into the growth trajectory, let's combine monthly metrics with the YoY growth. First, ensure you have a table that includes columns for the month, metric and you growth. To construct a combined chart, place the month column on the horizontal axis and represent the monthly new users on the left vertical axis using bars. Meanwhile, illustrate the YoY growth metric with a line on the right-hand axis. Consider the final chart below:
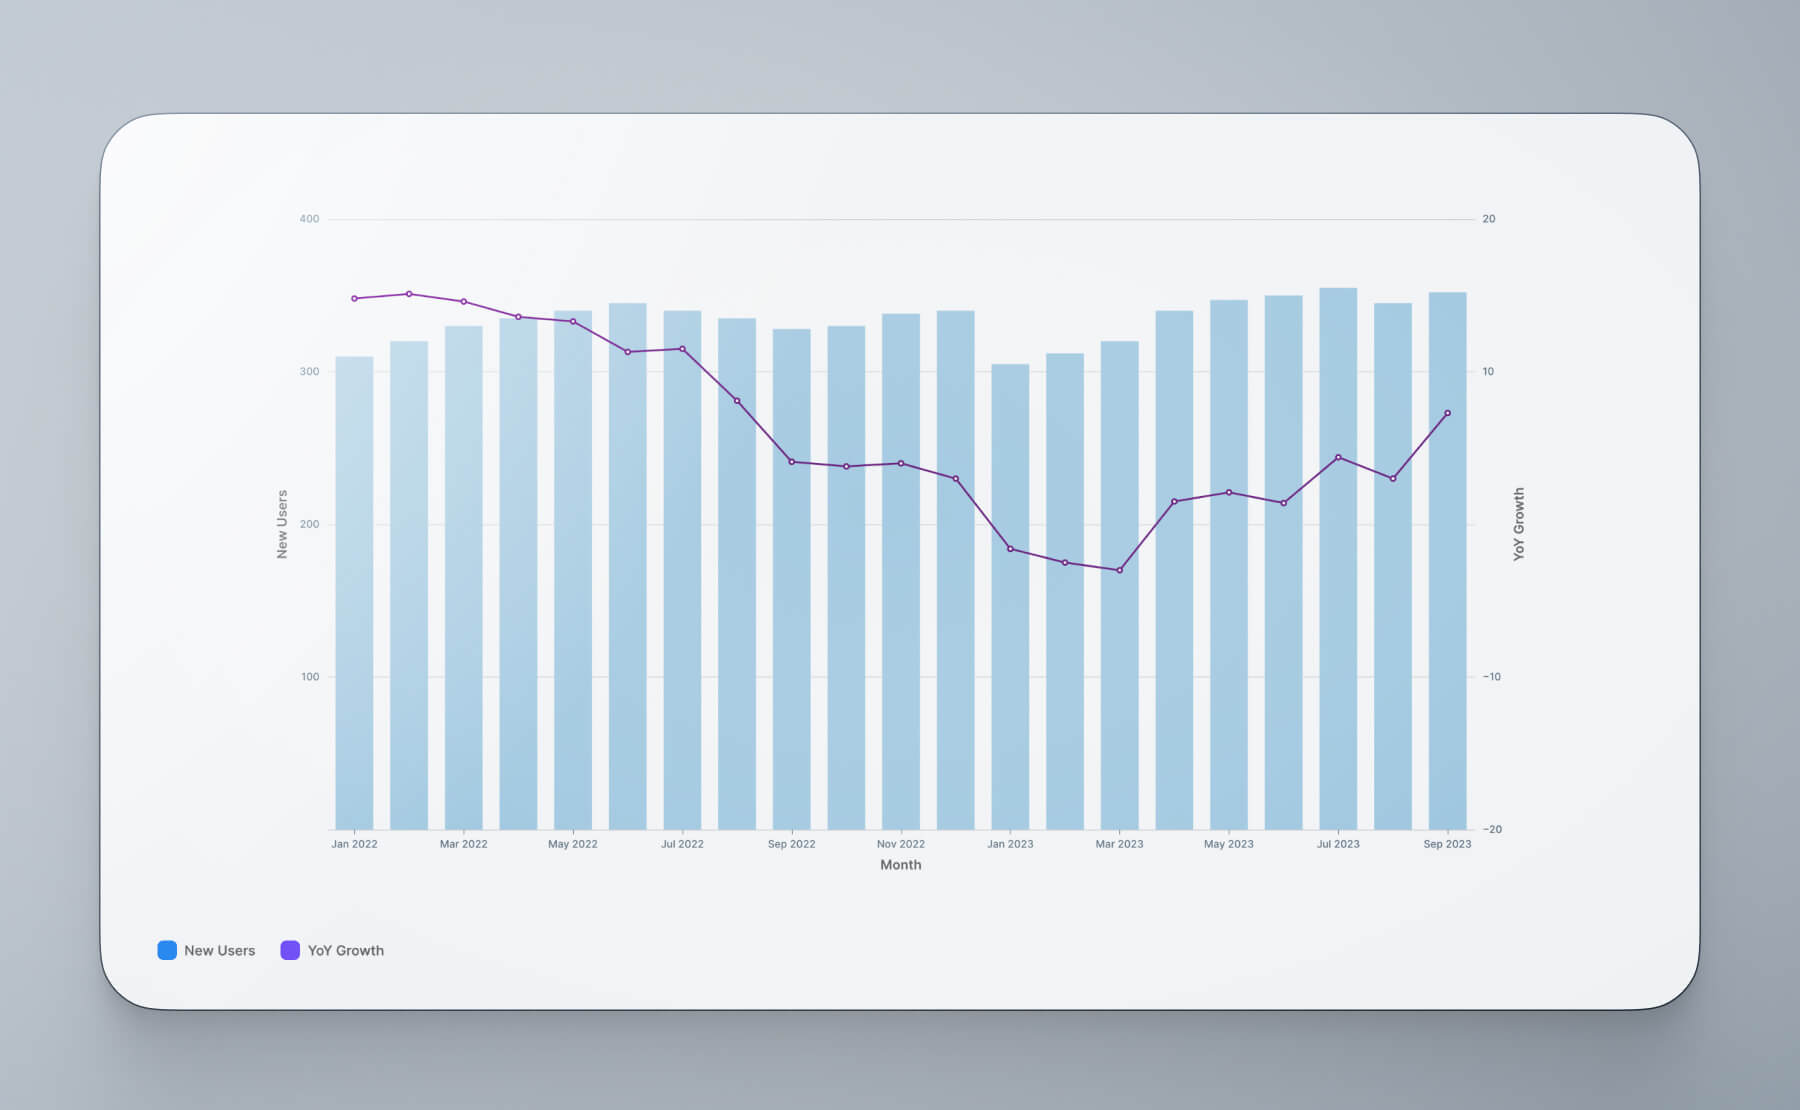 This way, we can evaluate the metric in relation to the previous year (identifying whether this year's figures are better than the last) while concurrently observing the growth trajectory. For example, while YoY growth might be positive, if the rate of growth is slowing down, it signals a need for proactive measures.
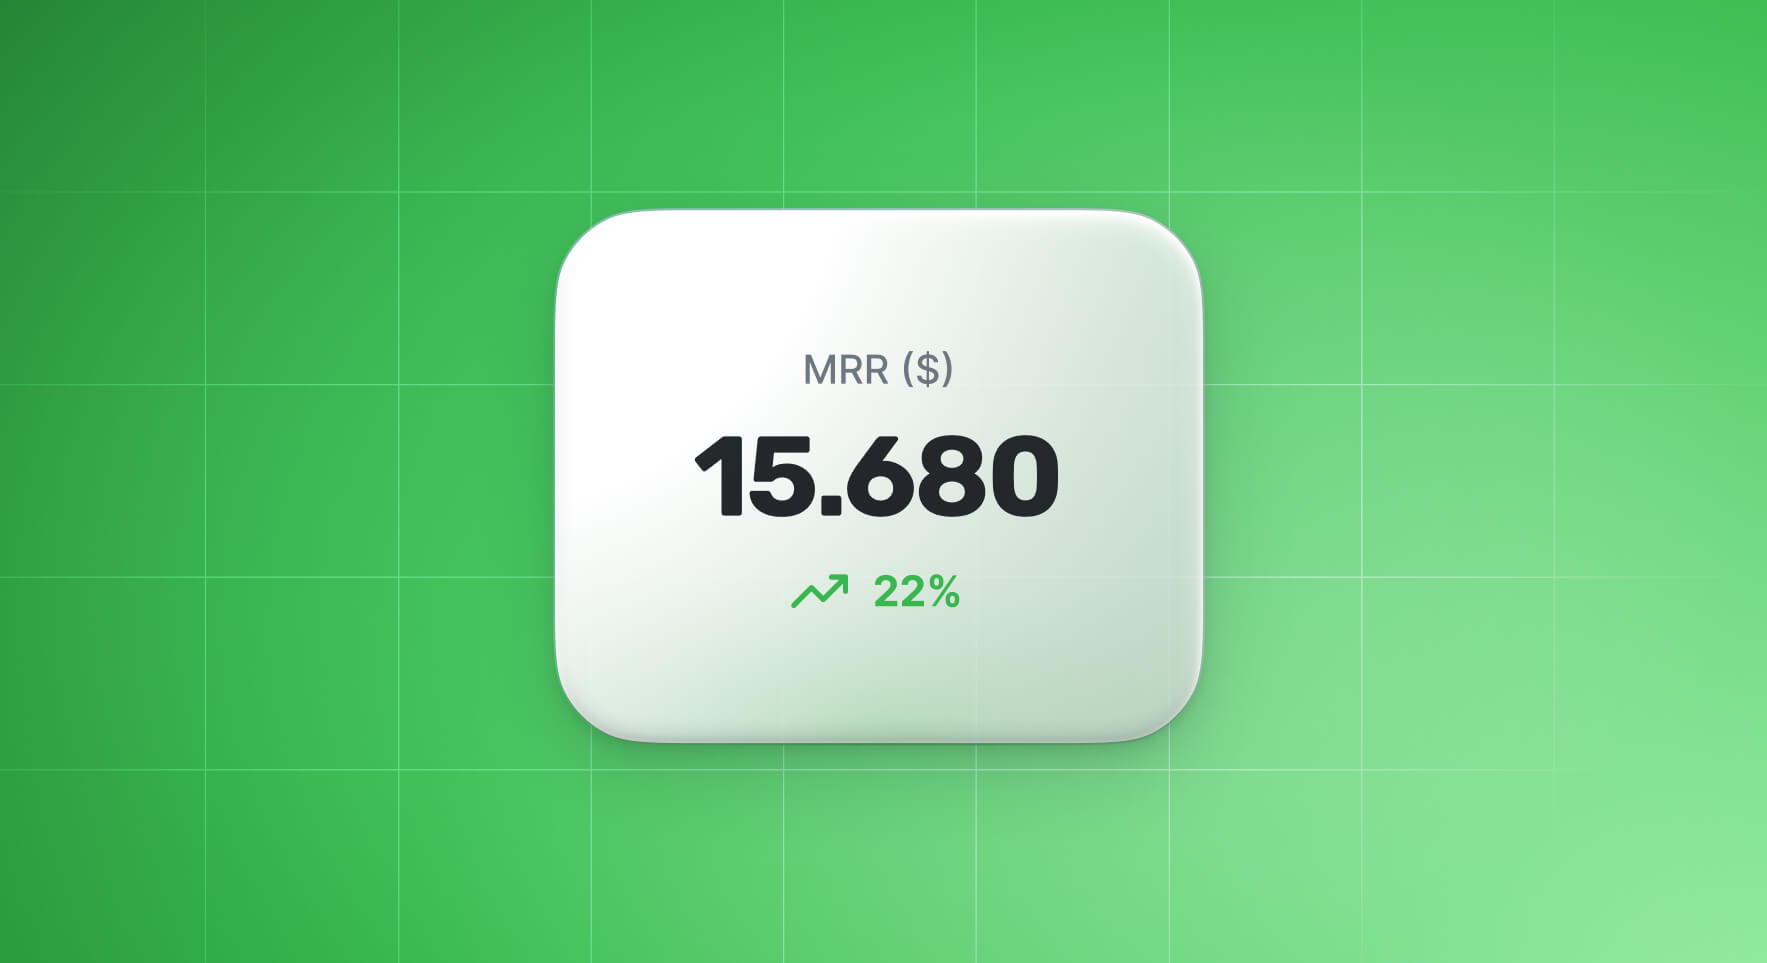
Alternatively, when the goal is to spotlight just the current month's metric alongside the YoY growth, using a big number visualization becomes advantageous. You should have columns for the year and the metric. Select the metric column as the value and use the year column to depict the trend as seen in the Monthly recurring revenue chart below.
YoY Growth in action: Use-cases and real-world examples
Beyond the basic understanding of YoY growth, let's delve into its practical application across different sectors:
Retail industry: Imagine a retail store that introduced a new product line last year. The sales of this product could have a significant YoY increase, especially if the product gained traction and became popular. By observing this surge, the store can anticipate inventory needs for the upcoming year, plan marketing campaigns, or even expand the product line.
SaaS businesses: For Software-as-a-Service (SaaS) companies, customer retention is crucial. By examining the YoY growth in subscriber numbers and comparing it to the rate of new sign-ups, these businesses can determine if their user base is growing organically or if there are potential issues with customer churn.
Tourism and hospitality: In regions where tourism is seasonal, like beach resorts or winter skiing locations, businesses might experience drastic YoY changes based on factors like weather conditions, global travel trends, or even geopolitical stability. A hotel in a popular summer destination could use YoY growth to anticipate bookings for the upcoming season, adjusting rates and promotions accordingly.
By observing these use-cases, it's clear that the YoY growth calculation isn't just a metric but a lens through which businesses can make informed strategic decisions. Whether it's product expansion, pricing strategies, or anticipating market trends, YoY growth serves as a valuable compass.
YoY calculation common mistakes/best practices
Best practices
To harness the full potential of YoY growth analysis and ensure reliable insights, businesses should adhere to specific best practices:
Consistent data collection: Ensuring that data is collected using the same methods and standards year after year guarantees reliable comparisons. Changes in data collection techniques can lead to disparities that aren't reflective of actual performance differences.
Supplementary metrics: While YoY provides a yearly perspective, metrics like MoM or QoQ offer more immediate insights. Employing these metrics in tandem can paint a comprehensive picture, helping businesses spot both long-term trends and short-term shifts.
Historical context: A one-year comparison might not be enough. It's crucial to look back multiple years to spot recurring patterns, anomalies, or unique events that could influence the YoY growth rate.
Recognize start-up growth patterns: New ventures often show staggering YoY growth rates in their initial stages. Understanding that this can result from a low starting point—and not just business success—ensures realistic expectations and interpretations.
Common mistakes
While YoY growth is a powerful analytical tool, certain pitfalls can skew interpretations and lead to misguided decisions. Being aware of these common mistakes is paramount:
- Being misled by outliers: A sudden surge or drop in a metric can distort YoY growth. For instance, a one-time marketing campaign or an unexpected event in the previous year can make current YoY growth seem misleadingly high or low. It's crucial to identify and understand such anomalies.
2.Overlooking short-term fluctuations: While YoY focuses on annual performance, there could be significant monthly or quarterly changes that it misses. If a business faces a new competitor or a product recall, YoY might not immediately reflect the resulting challenges.
Over-relying on percentages: For startups or businesses launching a new product, even a small increase in numbers can represent a massive percentage growth. While it's technically accurate, this can provide an inflated sense of success. Absolute figures, alongside percentages, offer a clearer perspective.
Neglecting external influences: External events, from economic downturns to global crises, can significantly influence a company’s YoY performance. Not recognizing the growth changes due to broader industry trends, regulatory changes, or global economic conditions and assuming such changes are solely due to internal strategies can lead to misguided business decisions.
Grasping the nuances of YoY growth and avoiding common pitfalls helps businesses make informed decisions, ensuring they respond effectively to genuine growth opportunities and challenges.
MoM growth calculation in SQL: MoM vs YoY
In addition to Year-over-Year (YoY) growth, understanding growth metrics over shorter time intervals is crucial. One such metric is the Month-over-Month (MoM) growth, which enables businesses to promptly identify and react to recent trends and adjust strategies. The foundational formula for MoM remains consistent, mirroring the YoY approach.
 The corresponding SQL query for MoM also closely resembles the YoY query. The main difference lies in the window function’s offset, shifting from 12 in YoY to just 1 for MoM calculation of monthly metrics.
select
    month,
    mrr,
    lag(mrr, 1) over (order by month) as mrr_previous_month,
    100 * (mrr / nullif(mrr_previous_month, 0) - 1) as mom_mrr_growth
from
    monthly_revenue
Conclusion
Year-over-Year (YoY) growth is a key metric for understanding how a business is doing over time. It's straightforward and helps quickly see longer-term trends. But, like any tool, it has its limits. To really grasp a company's performance, it's important to use YoY growth wisely and pair it with other metrics. When used together, these insights can offer a clearer view of where a business stands and where it's headed, helping leaders make smart decisions for the short and long term.
Throughout this article, we identified the role of YoY growth in tracking the longer-term performance of businesses. We've delved into the details of its calculations and demonstrated how businesses can compute this metric through practical SQL implementations. Alongside, we gained insight into visualizing YoY trends and understanding the potential pitfalls and best practices associated with its calculation.
PopSQL, the collaborative SQL editor, further streamlined our journey by facilitating seamless query execution and intuitive data visualization.
FAQ on YoY growth calculation
1. Why is YoY growth preferred over other metrics like MoM?
YoY growth provides a long-term view, making it easier to spot genuine trends by minimizing the noise from short-term fluctuations.
2. How is YoY growth different from MoM growth?
While YoY compares metrics over a 12-month period, MoM examines changes from one month to the next, offering a shorter-term view.
3. Can YoY growth be negative?
Yes, if the current year's value is less than the previous year's, YoY growth will be negative, indicating a decline.
4. How frequently should I calculate YoY growth?
Although it's a yearly metric, calculating YoY growth monthly or quarterly can help businesses stay updated with current trends.
